heikki.juva.lu
Display case for my projects and writeups. I mostly work on InfoSec, hardware hacking and electronics.
Project maintained by Zokol Hosted on GitHub Pages — Theme by mattgraham
Ruuvitag Gateway Setup
Since moving to a new house, I have been interested to learn how a building works.
While studying the engineering and science involved in building design and maintenance, many sources pointed out that temperature, humidity and pressure differences are key in figuring out if the building is designed well and is healthy a place to live in.
I initially spent way too many hours designing my own monitoring system, including cheap DH11-sensors. Results were completely unusable, as the cheap humidity sensors drift a lot over time. There also was no pressure sensor, so I could not get information of how the air moves inside the building.
Finally, I decided to get proper hardware to do the analytics, and decided to buy a 3-pack of ruuvitags
Here is a writeup of how to get data out from Ruuvitags and how to generate graphs from the data.
This is not sponsored post. I spent my own money on the devices. This writeup exists because I like design of a Ruuvitag and I want to share my thoughts with others.
Ruuvitag
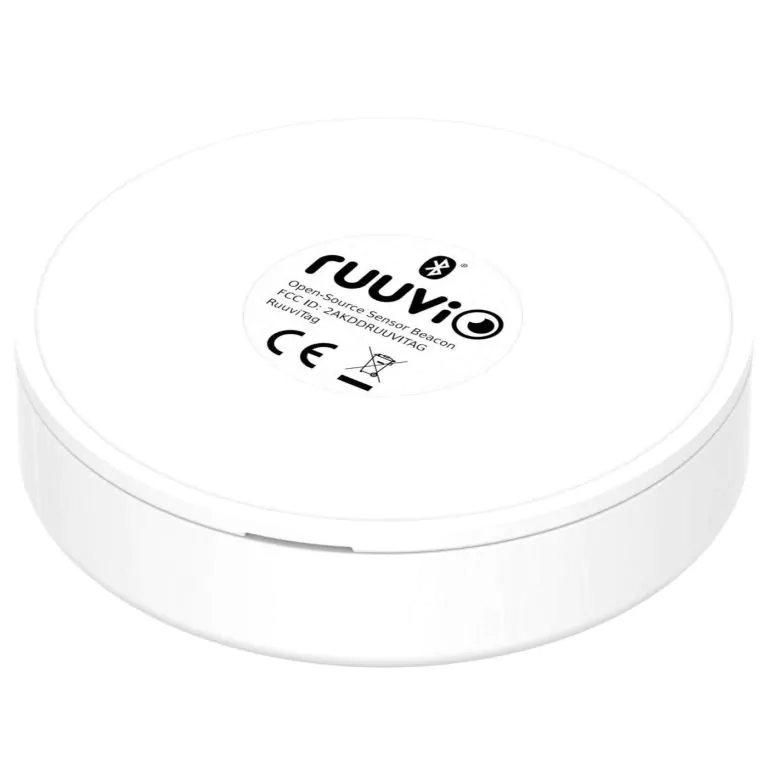
Ruuvitag is open-source product, which measures temperature, humidity, pressure and 3-axis acceleration. Telemetry is sent via BLE and Wirepass. BLE-protocol can be used to read the tags with smartphone or PC.
Wirepass-protocol forms an mesh-network, and allows larger array of sensors. To utilize wirepass, you need Ruuvi Gateway Router. I used Raspberry Pi 3B+ and on-board bluetooth-peripheral to read telemetry.
Ruuvitag is powered from a coin-cell battery (CR2477) and continues to operate until 1.7V. Manufacturer promises 1 year of lifetime for one cell, which is quite enough for my use.
Ansible
To get started, I found this awesome project by Ilpo Latvala: https://github.com/ilatvala/ruuvigw
Ilpo’s Ansible playbook already includes following components:
- ruuvicollector - Java-application to read BLE-packets and parse the data into readable format
- InfluxDB - Time-series database to store the collected telemetry
- Grafana - Visualization of data
The playbook also configures everything, so in theory you just need to set the correct MAC-addresses for your ruuvitags and run the playbook.
To run the playbook, you simply need to download the ruuvigw.yml-file and run ansible-playbook -i "127.0.0.1," ruuvigw.yml
Ruuvitag address setup
To link the collected telemetry to human-readable name of the sensor, you need to tell the ruuvicollector-service the names of your ruuvitags.
On line 12 of the playbook, you will find the “ruuvinames”-section:
  ruuvinames: |
      A67C075F95C6=Bedroom
      FC20740F6709=Auto
      D3739F4B97AA=Sauna
Here, the cryptic-looking string of letters and numbers is the Ruuvitag’s unique identifier, Bluetooth MAC-address.
You can find the correct MAC-address of each tag by going to the Ruuvi Station app on your phone. From settings, scroll down and you will find “MAC-address”-field. Write those characters, without the colon-marks, in the “ruuvinames”-section and add a name for the sensor.
For example, if the MAC-address for a sensor in Ruuvi Station app would be B6:3C:47:CF:90,
and the sensor is placed in the kitchen, the “ruuvinames”-section would look like this:
  ruuvinames: |
      B63C47CF90=Kitchen
Buster-support
In reality this step was a bit more complex, as I was running the playbook on Raspberry Pi, with 2022-01-28 Raspberry Pi OS (Buster). It seems that because I was using older Debian Buster, the Ansible version was older than the one the playbook used. When trying to run the playbook, it could not use several parameters, and it did not find correct version of the python-interpreter.
Here is the fixed version of the playbook for Debian Buster
Graphs
After successfully running the Ansible playbook, you can login to Grafana via https://localhost
If you are running the Ruuvi Gateway on another computer, check the IP-address of it via ip addr and use that address in browser.
For example:
pi@ruuvi-gateway$ ip addr
1: lo: <LOOPBACK,UP,LOWER_UP> mtu 65536 qdisc noqueue state UNKNOWN group default qlen 1000
    link/loopback 00:00:00:00:00:00 brd 00:00:00:00:00:00
    inet 127.0.0.1/8 scope host lo
       valid_lft forever preferred_lft forever
2: eth0: <BROADCAST,MULTICAST,UP,LOWER_UP> mtu 1500 qdisc pfifo_fast state UP group default qlen 1000
    link/ether XXXXXXXXXXXXXXXX brd ff:ff:ff:ff:ff:ff
    inet 192.168.1.109/24 brd 192.168.1.255 scope global dynamic noprefixroute eth0
       valid_lft 50154sec preferred_lft 34705sec
3: wlan0: <NO-CARRIER,BROADCAST,MULTICAST,UP> mtu 1500 qdisc pfifo_fast state DOWN group default qlen 1000
    link/ether XXXXXXXXXXXXXXXX brd ff:ff:ff:ff:ff:ff
In this case, I would open grafana by going to http://192.168.1.109
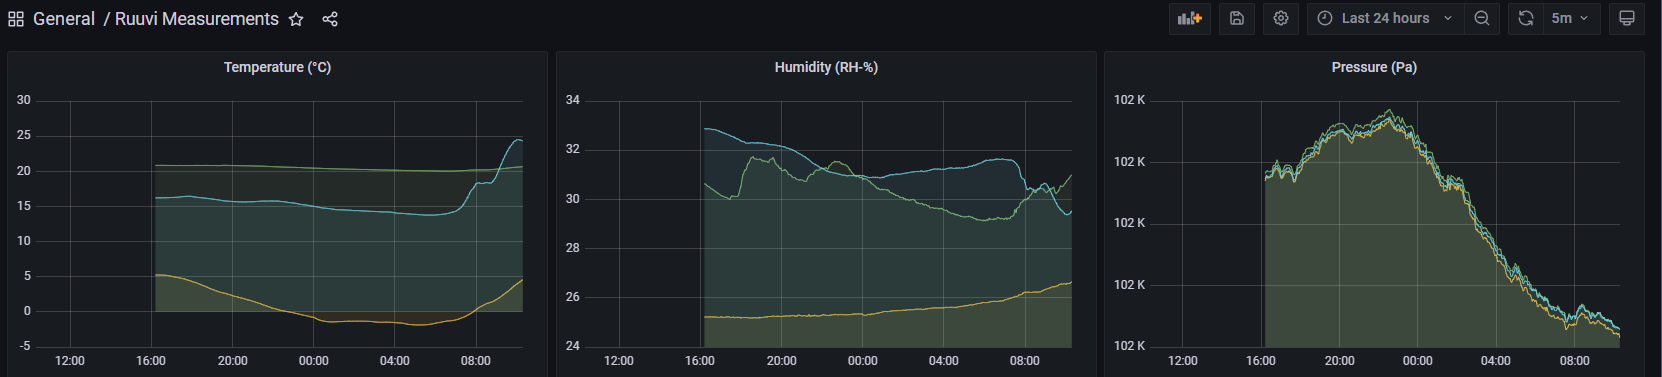
After opening Grafana, you should see few ready-made dashboards on the first page; Ruuvi Measurements, Ruuvi V2 and Ruuvi Analytics
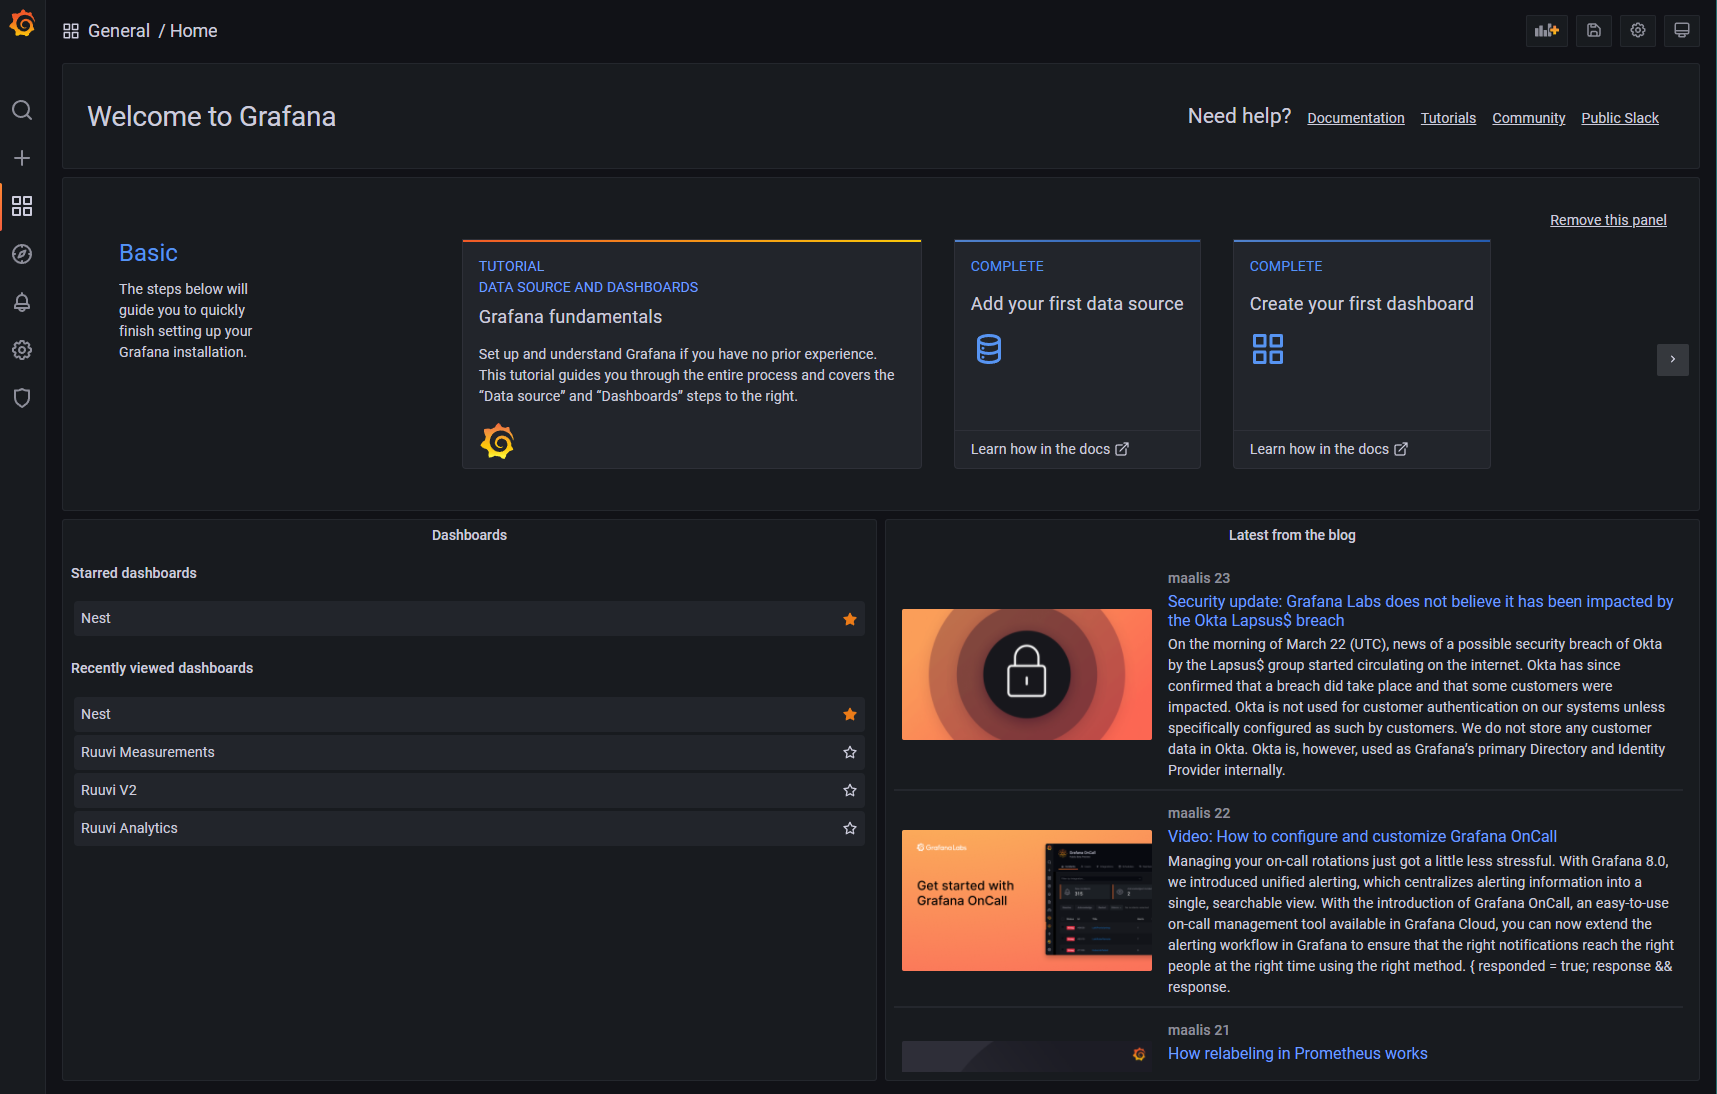
By going to Ruuvi Measurements, you can find the raw telemetry pulled from the tags. This is good starting point for your own dashboard.
Better legend labels
By default, the graph legend looks something like ruuvi_measurements.mean {mac: A67C075F95C6}
This is not very useful, but you already set the name for this MAC while configuring the playbook, so let’s add that to the legend.
Click Edit on graph menu
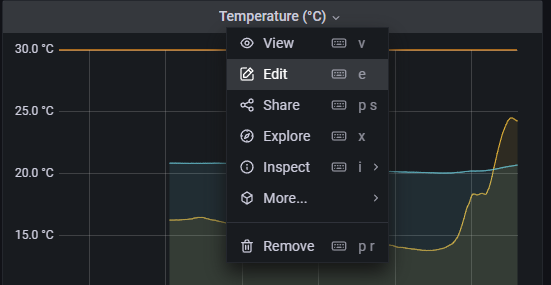
Add $tag_name on ALIAS-field
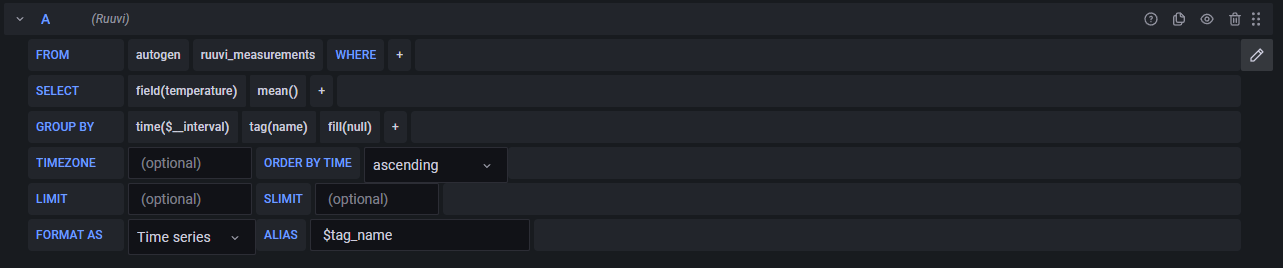
Click Apply-button on the top-right corner.
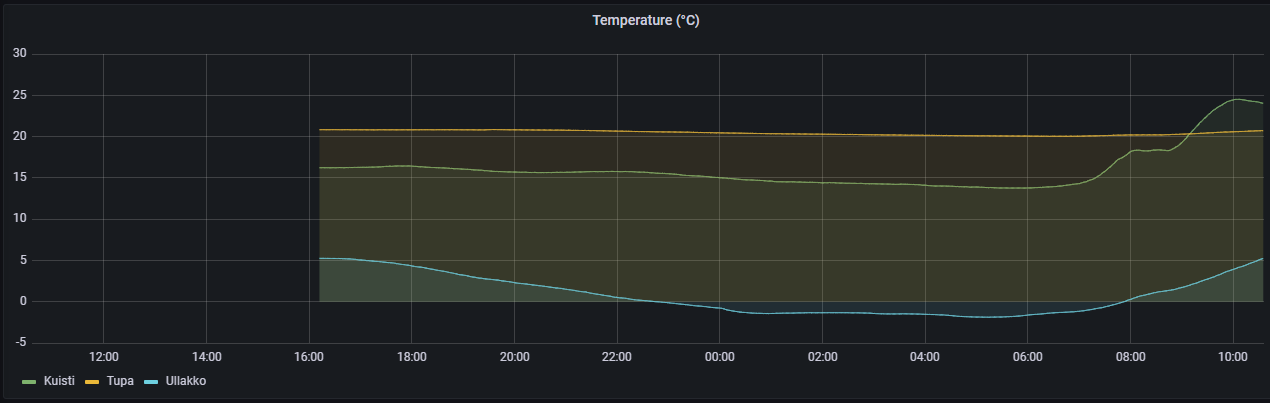
Now the graph legend shows tag names instead of MAC-addresses
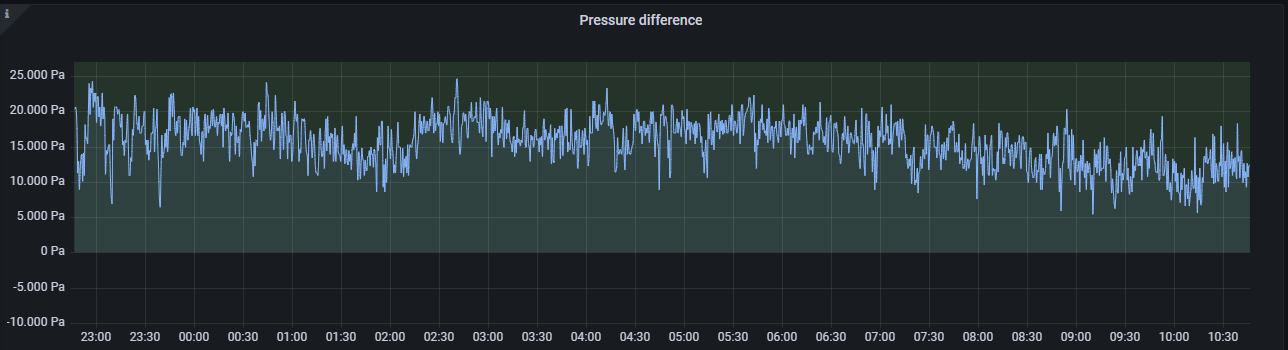
Pressure difference graph
I wanted a graph to illustrate how air moves inside the building. Especially I wanted to ensure that the intake of air is always from outside, from fresh air.
I placed one sensor in the attic of the building, and second sensor in the middle of the living space. Theory is that as long as there is positive pressure in the living space, compared to the attic, the fresh air is always pulled from outside and not from the attic.
If instead there would be negative pressure between these two spaces, the “fresh air” would be pulled from attic, via the insulation of the building, causing poor quality air to be pulled to the living space.
To solve the pressure difference, I created new graph, with two queries: Pressure from attic and pressure from living space
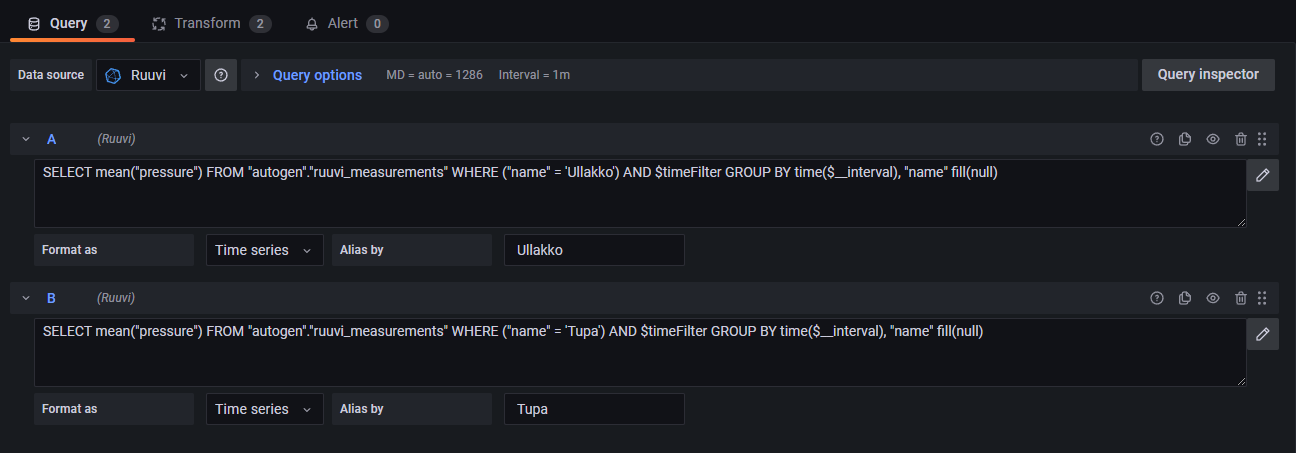
You can open the raw query editor by clicking the pen-icon on the right.
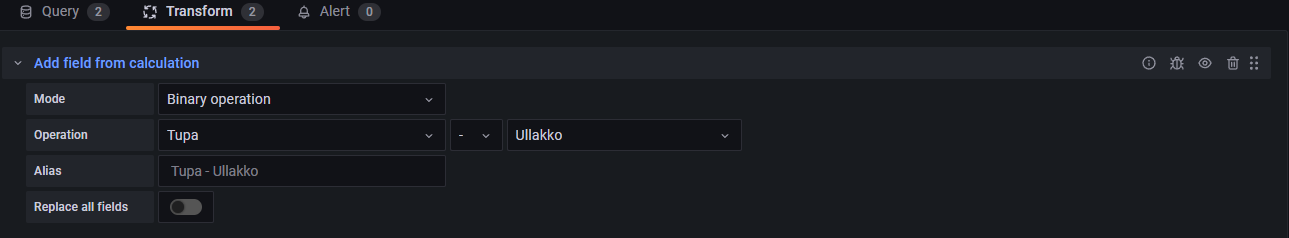
In Transform-tab, I added a binary operation to create a graph of the difference between these two pressures.
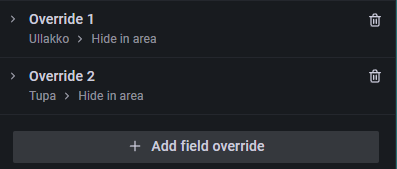
Then, to clean up the graph, I added an field override to remove the raw pressure graphs:
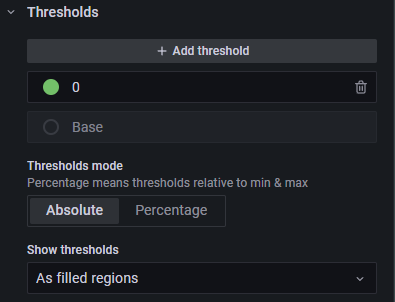
I also added a treshold to 0, creating green area of positive pressure. This gives us nice visual feedback that if the graph is in the green-area, everything is good.
After all this, you get a nice graph of the pressure difference between these two sensors.